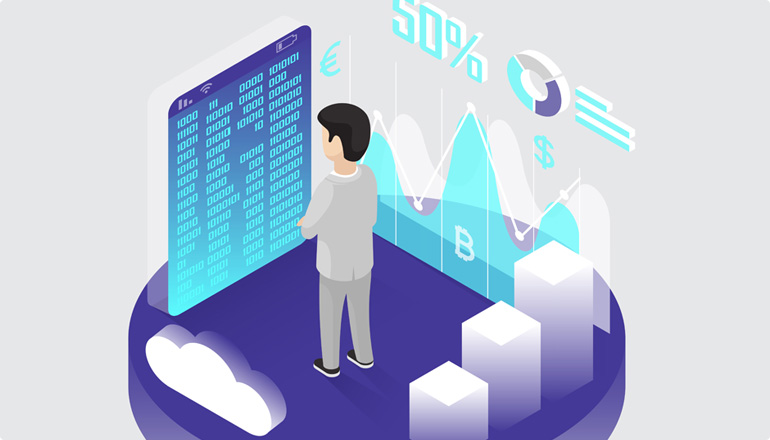
At Lordtech Datus Solutions Pvt. Ltd. , our Data Visualization services help transform complex datasets into intuitive, visually appealing dashboards and reports. Using industry-leading tools like Tableau, Power BI, MATLAB, & Python (Matplotlib, Seaborn), we create clear and interactive visualizations that make it easy to understand trends, patterns, and insights. Whether you need customized charts, graphs, or real-time dashboards, our visualizations enable you to quickly grasp critical business metrics and make data-driven decisions with confidence.
Start your project today+91-8077281918
+91-9319250172